On May 20, the Governors Highway Safety Association (GHSA) released the preliminary pedestrian fatality data for 2020.
Here’s what stands out in the initial report.
- GHSA is projecting 6,721 pedestrian deaths in 2020, compared to 6,412 fatalities in 2019. That’s a nearly 5% increase.
- The increase in the fatality rate isn’t just significant: it is the biggest annual jump ever recorded by the organization.
- Pedestrians accounted for 17% of all traffic deaths in 2019, compared to 13% in 2010.
- Black, Indigenous, and People of Color are a larger proportion of pedestrian fatalities, compared to their respective populations.
While the full GHSA report uses data from 2010to demonstrate traffic violence trends, the preliminary 2020 data stands out because of the pandemic conditions. As you might expect, fewer people were driving for work or leisure last year.
For statistical analysis, researchers look at vehicle miles traveled (VMT). This number is the total annual miles of vehicle travel, divided by the total population of the area.
In 2020, there was a 13.2% decrease in VMT overall. Yet, the pedestrian fatality increased by 21% over 2019. That means while there were fewer vehicles on the road, people on foot were more likely to be killed by them.
Pedestrian fatality trend in Washington
The GHSA reports 47 pedestrian fatalities in Washington from January – June 2020.
The Washington State Department of Transportation data shows 104 fatalities for all of 2020.
Injury Type
Pedestrians Fatalities: 104
Suspected Serious Injuries: 307
Suspected Minor Injuries: 658
Possible Injuries: 487
No Apparent Injuries: 77
Total Pedestrians: 1,633
That’s actually slightly higher than GHSA preliminary numbers—which are already up 7% over 2019.
What’s even more troublesome to us are the locations and patterns of these crashes. Anecdotally, our office has seen a big uptick in the number of people hit by a car in a parking lot.
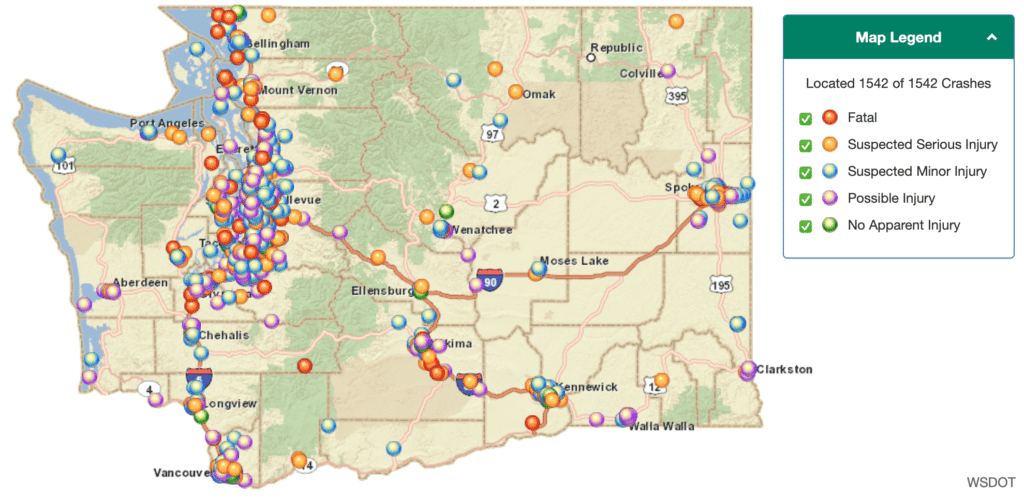
Here’s the WSDOT map of all the pedestrian collisions in Washington last year. The red markers designate fatalities.
And here’s the same map, zoomed in to the Seattle metro area.
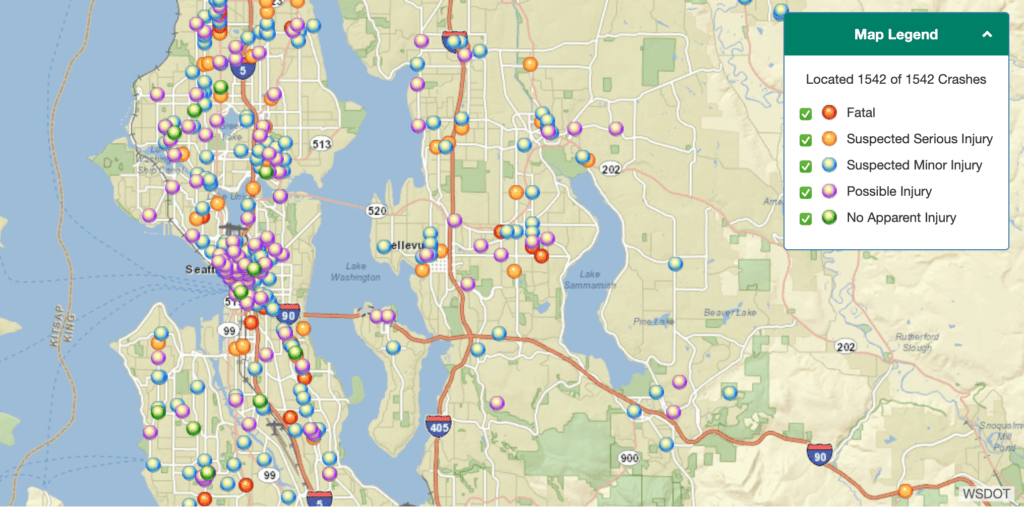
Aside from the fatality markers, there are two things worth noticing about these maps.
First, look at the clusters of crash markers along State Route 99. This road includes Pacific Highway, East Marginal Way and Aurora Avenue in Seattle, and goes up to Evergreen Way in Everett. If you have ever walked or driven on these sections of SR 99, this image is likely not surprising.
Second, if you look at the map keys (and the statistics above), you will see that 77 of these collisions were coded with “No apparent injury.” Another 487 were coded as “Possible injury.”
These designations are both concerning and suspicious, because the people making the assessments are officers of the law—not paramedics or medical professionals. And, it is unusual for a human body to have “no injury” after being struck by a 3,000-lb moving vehicle.
In addition to the fatalities, 1500 people got hit by a car or truck in Washington last year. They didn’t die, but no one walks away from that unscathed.
Causes of the dangerous death trend
Attributing crash factors nationwide is a complicated, because some of the information is subjective. For example, Arizona officers might not look at “distracted driving” as a fatal crash factor the same way as Washington State Patrol officers.
But most of us are familiar with the usual suspects of traffic violence.
The likely culprits are dangerous driving like speeding, drunk and drugged driving, and distraction, which were rampant on U.S. roads during the COVID-19 pandemic,
combined with infrastructure issues that have prioritized the movement of motor vehicles over walking and bicycling for many years.
While it is important to talk about how our behavior as drivers can harm people, we have long focused on individual actions over systemic changes. For example, how our streets and roads are designed to prioritize vehicle speed over pedestrian safety. Seattle speed limit changes for safer streets.
The 2020 traffic fatalities report isn’t final yet, but the trends are very alarming. The sooner we identify and solve these issues, the safer we will all be.
References:
Pedestrian Traffic Fatalities by State: 2020 Preliminary Data Addendum
Washington State Crash Data Portal: https://remoteapps.wsdot.wa.gov/highwaysafety/collision/data/portal/public/